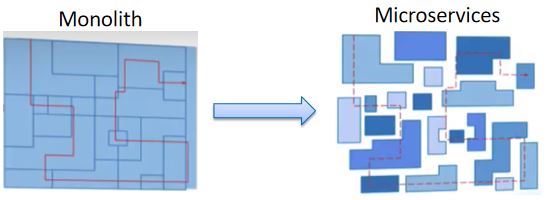
While evolving towards a microservices architecture, the biggest change is that the monolith application has been divided into multiple independent processes(or services), as a result, a method call between software modules now becomes a remote procedure call go through multiple services.
A client request usually goes through a couple of or even a dozen of services in a complex microservices system, which makes it really hard to figure out what’s going on when a request fails or becomes slow.
 Basically, in order to get the overall view of a client request, we need to collect all the related information of service invocations in the path of that request, including start time, end time, URL, errors, etc., and associate all the collected data within a single trace. This process is normally called distributed tracing.
Distributed Tracing with Istio
Istio/Envoy provides out-of-the-box distributed tracing for microservices. Envoy can intercept the incoming and outgoing requests of the service in the same pod and automatically generates tracing data for them. By connecting the mesh with a tracing infrastructure backend such as Zipkin or Jaeger, you can get the trace details of a distributed request, such as which services a request went through, which REST APIs were called, and the latency of each span, etc.
It should be noted that although Istio/Envoy has done most of the work in this process, it still requires a small amount of modification to the application code: the application code needs to propagate the tracing header in the upstream HTTP requests to its downstream services. This part of the code can’t be handled directly by Envoy because Envoy just doesn’t understand the business logic of the service co-located with it, and therefore it can’t infer the affiliation of incoming requests with the outgoing requests correctly. Although the modification is a minor change, it needs to be added manually to every piece of code where a request is forwarding to a downstream service, which is annoying.
Let’s use a simple online shop demo to show how Istio provides distributed tracing. The demo consists of several services: eshop, inventory, billing, and delivery. The structure of the application is shown in the following figure:
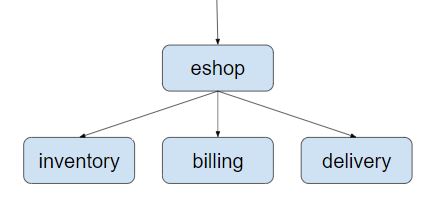 eshop service accepts requests from the client sides, then it calls the REST APIs of inventory, billing, delivery services to accomplish the checkout user request.
Codes can be downloaded from Github: https://github.com/zhaohuabing/istio-opentracing-demo.git
Below is the implementation of the checkout function of eshop Service, as you can see, tracing related HTTP Headers are propagated to downstream services.
 @RequestMapping(value = "/checkout")
public String checkout(@RequestHeader HttpHeaders headers) {
    String result = "";
    // Use HTTP GET in this demo. In a real world use case,We should use HTTP POST
    // instead.
    // The three services are bundled in one jar for simplicity. To make it work,
    // define three services in Kubernets.
    result += restTemplate.exchange("http://inventory:8080/createOrder", HttpMethod.GET,
            new HttpEntity<>(passTracingHeader(headers)), String.class).getBody();
    result += "<BR>";
    result += restTemplate.exchange("http://billing:8080/payment", HttpMethod.GET,
            new HttpEntity<>(passTracingHeader(headers)), String.class).getBody();
    result += "<BR>";
    result += restTemplate.exchange("http://delivery:8080/arrangeDelivery", HttpMethod.GET,
            new HttpEntity<>(passTracingHeader(headers)), String.class).getBody();
    return result;
}
private HttpHeaders passTracingHeader(HttpHeaders headers) {
    HttpHeaders tracingHeaders = new HttpHeaders();
    extractHeader(headers, tracingHeaders, "x-request-id");
    extractHeader(headers, tracingHeaders, "x-b3-traceid");
    extractHeader(headers, tracingHeaders, "x-b3-spanid");
    extractHeader(headers, tracingHeaders, "x-b3-parentspanid");
    extractHeader(headers, tracingHeaders, "x-b3-sampled");
    extractHeader(headers, tracingHeaders, "x-b3-flags");
    extractHeader(headers, tracingHeaders, "x-ot-span-context");
    return tracingHeaders;
}
Then let’s deploy the demo in a Kubernetes cluster along with Istio.
- First, we need a Kubernetes cluster with Webhook enabled
- Deploy Istio in the Kubernetes cluster, and enable sidecar auto-injection for the default namespace
- Deploy eshop application
git clone https://github.com/zhaohuabing/istio-opentracing-demo.git
cd istio-opentracing-demo
git checkout without-opentracing
kubectl apply -f k8s/eshop.yaml
- Open this URL in your browser to invoke eshop checkout REST API: http://${NODE_IP}:31380/checkout
- Open Jaeger UI to see the trace: http://${NODE_IP}:30088
Note: In order to access Jaeger UI from outside of the Kubernetes Cluster, you may want to modify Istio install scripts to add a NodePort for Jaeger service:
apiVersion: v1
  kind: Service
  metadata:
    name: jaeger-query
    namespace: istio-system
    annotations:
    labels:
      app: jaeger
      jaeger-infra: jaeger-service
      chart: tracing
      heritage: Tiller
      release: istio
  spec:
    ports:
      - name: query-http
        port: 16686
        protocol: TCP
        targetPort: 16686
        nodePort: 30088
    type: NodePort
    selector:
      app: jaeger
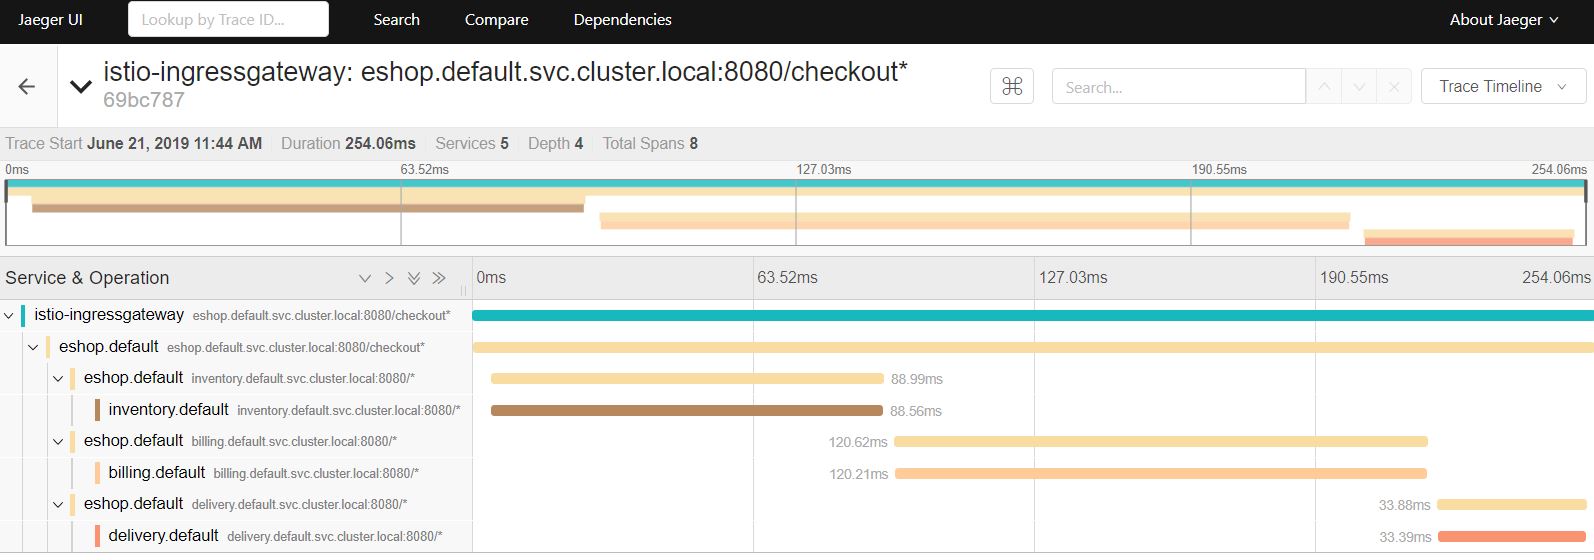
As you can see, Istio/Envoy automatically generates a trace for the client request. The trace is comprised of several spans, and each span corresponds a REST method of a service in the chain of services invoked by the client request.
Using Opentracing for Trace Context Propagation
Instead of explicitly passing the HTTP headers, we can use Opentracing instrumentation for trace Context propagation. It’s pretty simple:
- Add Opentracing Spring Cloud Starter and Jaeger dependency in the maven POM file.
- Declare a tracer bean in the spring application.
@Bean
public Tracer jaegerTracer() {
	// The following environment variables need to set
	// JAEGER_ENDPOINT="http://10.42.126.171:28019/api/traces"
	// JAEGER_PROPAGATION="b3"
	// JAEGER_TRACEID_128BIT="true" Use 128bit tracer id to be compatible with the
	// trace id generated by istio/envoy
	return Configuration.fromEnv("eshop-opentracing").getTracer();
}
There are two things that we need to pay attention:
- By default, the Jaeger tracer uses the uber-trace-id HTTP header format, which is not supported by Istio/Envoy. Therefore, we need to specify the b3 HTTP header format in environment variables to make it compatible with Istio/Envoy.
- The Jaeger tracer uses a 64-bit trace id by default, while Istio/Envoy uses a 128-bit trace id. Therefore, we need to specify the trace id length as 128 bit in environment variables to be compatible with Istio/Envoy.
Deploy the version of the demo application that uses Opentracing for trace context propagation.
git checkout master
kubectl apply -f k8s/eshop.yaml
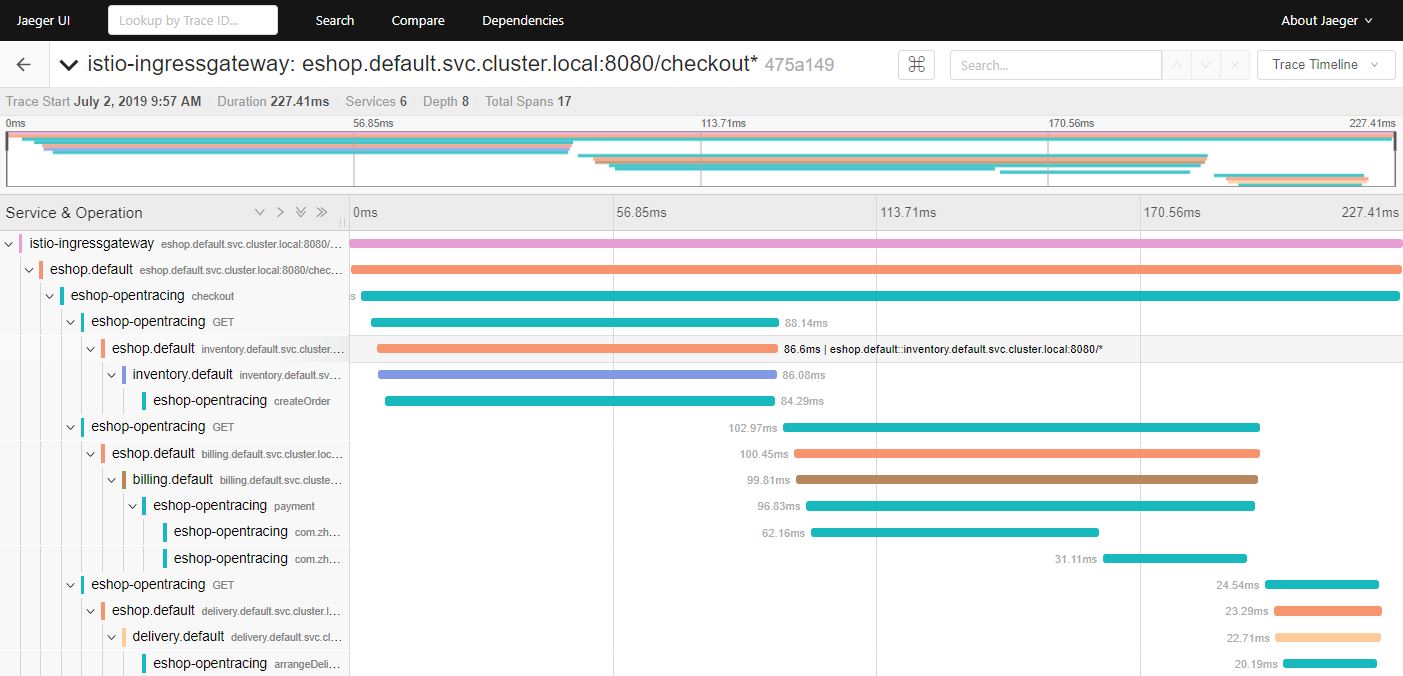
As you can see from the above figure, one interesting thing is that 7 more spans have been inserted to the trace. These spans are implicitly generated by Opentracing Spring instrumentation. They provide us with more detailed information about the request. From these news spans, we can infer that it only takes about 1 millisecond for Envoy to proxy the request, it’s a very short time and it has nearly no impact on the latency of the client request.
Adding Method-Level Tracing to Istio
The distributed tracing capability of Istio/Envoy can only capture the tracing span at the process boundaries, which would be good enough in most cases. However, for some services, we may want more fine-grained trace information for a better understanding of what happened inside a process, such as the latency caused by a method call or SQL insert. To accomplish that, we need to instrument the code where we need to collect tracing data and associate the collected tracing data with the trace created by Envoy, then, we can see all the spans in a single trace on the Jager UI.
AOP and Annotation can be used to simplify the instrumentation code. First, let’s define a Traced annotation and the corresponding AOP implementation logic:
@Retention(RetentionPolicy.RUNTIME)
@Target(ElementType.METHOD)
@Documented
public @interface Traced {
}
@Aspect
@Component
public class TracingAspect {
    @Autowired
    Tracer tracer;

    @Around("@annotation(com.zhaohuabing.demo.instrument.Traced)")
    public Object aroundAdvice(ProceedingJoinPoint jp) throws Throwable {
        String class_name = jp.getTarget().getClass().getName();
        String method_name = jp.getSignature().getName();
        Span span = tracer.buildSpan(class_name + "." + method_name).withTag("class", class_name)
                .withTag("method", method_name).start();
        Object result = jp.proceed();
        span.finish();
        return result;
    }
}
Then add the Traced annotation to the methods we would like to trace:
@Component
public class DBAccess {

    @Traced
    public void save2db() {
        try {
            Thread.sleep((long) (Math.random() * 100));
        } catch (InterruptedException e) {
            e.printStackTrace();
        }
    }
}
@Component
public class BankTransaction {
    @Traced
    public void transfer() {
        try {
            Thread.sleep((long) (Math.random() * 100));
        } catch (InterruptedException e) {
            e.printStackTrace();
        }
    }
}
The output is shown in the figure below. You can see that two methods-level spans (transfer and save2db) have been inserted into the trace.
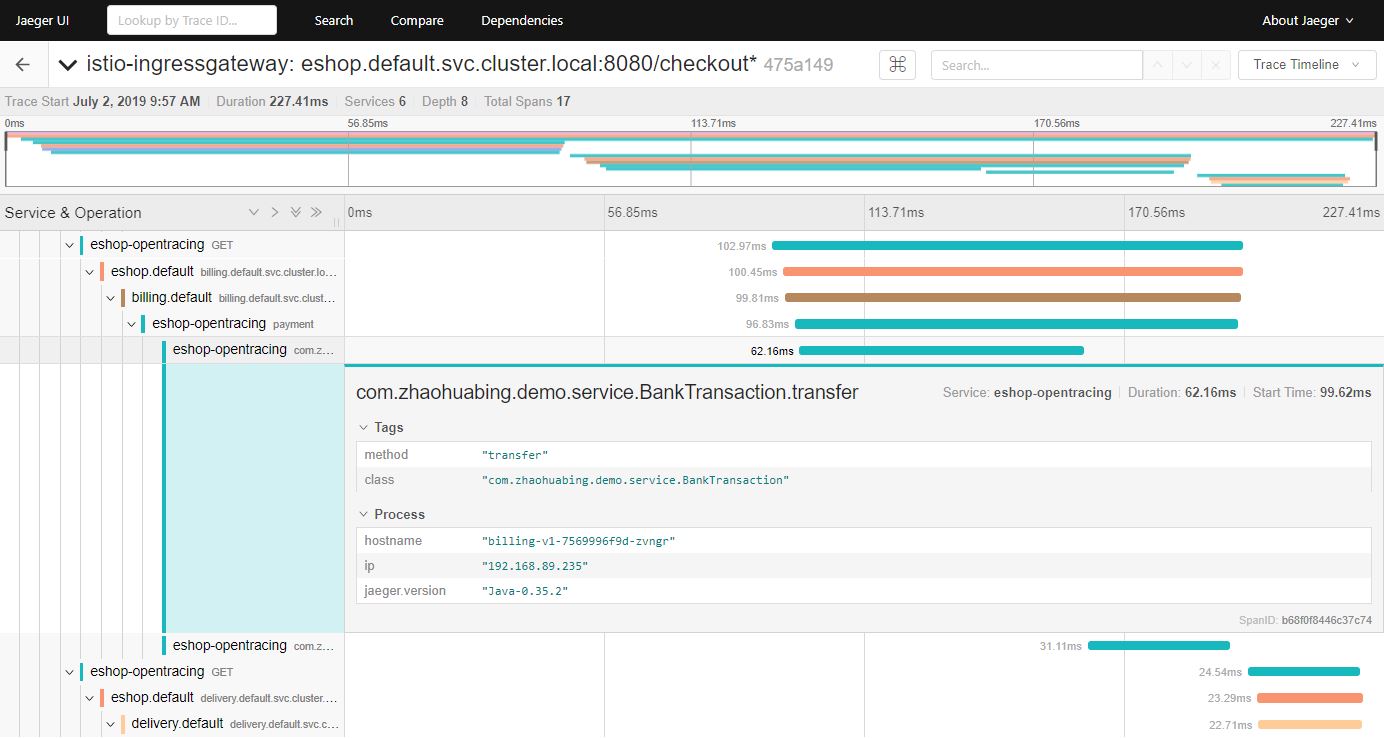 You can open the span to view the details of the method call, including the Java class name, the method name, etc. If needed, you can also add other useful information such as the exception stack in the tracing, it can be easily done by just modify TracingAspect code.

Wrapping up
Istio gives you deep insight into your service mesh by its build-in distribute tracing capabilities. In this blog, we explored how we could leverage Opentracing to propagate tracing header for Istio and how to get more fine-grained tracing by inserted method-level spans into the Istio generated trace.
What’s next
Async messaging is also a very common mechanism for microservice communication, however, Istio hasn’t addressed that for now. In the next post, we’ll take a look at how to trace Kafka messages with the help of Opentracing in an Istio service mesh. Stay tuned!
References
- Source Code
- Opentracing docs
- Opentracing specification
- Opentracing wire protocols
- Istio Trace context propagation
- Using OpenTracing with Istio/Envoy
- Zipkin-b3-propagation
- Istio 调用链埋点原理剖析—是否真的“零修改”?
- OpenTracing Project Deep Dive