In the previous post, we discussed how to use Opentracing to help Istio Service Mesh to propagate tracing context across process boundaries, and how to enrich Istio/Envoy generated traces with method-level spans to get more fine-grained insights to the services.
For now, all that we have been talking is just about synchronous RPC (HTTP/REST), however, we can’t ignore the fact that asynchronous messaging is also widely adopted as an inter-services communication mechanism. So in this post, we will continue to use the eshop demo to explore how asynchronous messaging, specifically Kafka, can be traced in Istio service mesh with the help of Opentracing.
Eshop Demo Application
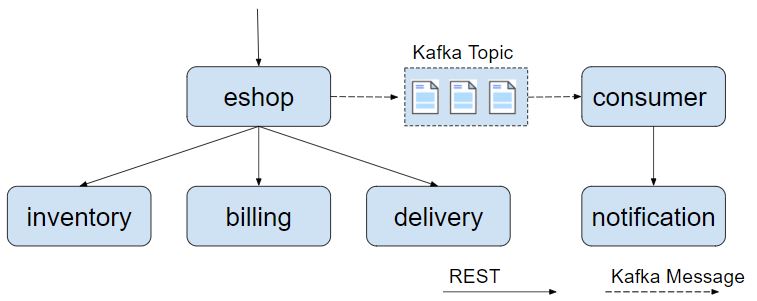
As depicted in the below diagram, the demo application has been modified to add asynchronous messages related logic. After calling the inventory, billing, and delivery services, the eshop service sends a message to a Kafka topic. The consumer service is listening on this Kafka topic. Once receiving the message, it calls the notification service to send out an email to notify the user that the transaction is successfully done.
Kafka Opentracing Instrumentation
The source code can be downloaded from Github.
git clone [email protected]:zhaohuabing/istio-opentracing-demo.git
git checkout kafka-tracking
There’re two directories in the project root of the source code: rest-service and kafka-consumer. The code of restful services is put under the rest-service directory, while the kafka consumer code is in the kafka-consumer directory.
First, the dependencies for spring-kafka and opentracing-kafka should be included in the project pom file.
<dependency>
	<groupId>org.springframework.kafka</groupId>
	<artifactId>spring-kafka</artifactId>
</dependency>
 <dependency>
	<groupId>io.opentracing.contrib</groupId>
	<artifactId>opentracing-kafka-client</artifactId>
	<version>${version.opentracing.kafka-client}</version>
</dependency>
The next step is configuring the Kafka producer factory to enable Opentracing instrumentation at the producer side.
@Bean
public ProducerFactory<String, String> producerFactory() {
    Map<String, Object> configProps = new HashMap<>();
    configProps.put(ProducerConfig.BOOTSTRAP_SERVERS_CONFIG, bootstrapAddress);
    configProps.put(ProducerConfig.KEY_SERIALIZER_CLASS_CONFIG, StringSerializer.class);
    configProps.put(ProducerConfig.VALUE_SERIALIZER_CLASS_CONFIG, StringSerializer.class);
    configProps.put(ProducerConfig.INTERCEPTOR_CLASSES_CONFIG, TracingProducerInterceptor.class.getName());
    return new DefaultKafkaProducerFactory<>(configProps);
}
You’ll also need to configure instrumentation at the consumer side in a similar way.
@Bean
public ConsumerFactory<String, String> consumerFactory() {
    Map<String, Object> props = new HashMap<>();
    props.put(ConsumerConfig.BOOTSTRAP_SERVERS_CONFIG, bootstrapAddress);
    props.put(ConsumerConfig.GROUP_ID_CONFIG, groupId);
    props.put(ConsumerConfig.KEY_DESERIALIZER_CLASS_CONFIG, StringDeserializer.class);
    props.put(ConsumerConfig.VALUE_DESERIALIZER_CLASS_CONFIG, StringDeserializer.class);
    props.put(ConsumerConfig.INTERCEPTOR_CLASSES_CONFIG, TracingConsumerInterceptor.class.getName());
    return new DefaultKafkaConsumerFactory<>(props);
}
That’s all for the Kafka Opentracing instrumentation, it’s pretty simple, right? Then, let’s run this example to see the actual tracing output.
Install Kafka
In order to run the demo application, we’ll need a Kafka cluster installed. You can either deploy Kafka following the guidance in Kafka Quickstart, or deploy Kafka in Kubernetes with Kafka Operator.
Deploy Demo Application
Configure k8s/eshop.yaml with the appropriate Kafka bootstrap server address.
apiVersion: extensions/v1beta1
kind: Deployment
metadata:
  name: eshop-v1
  ......
    spec:
      containers:
      - name: eshop
        image: zhaohuabing/istio-opentracing-demo:kafka-opentracing
        ports:
        - containerPort: 8080
        env:
          ....
          //在这里加入Kafka server地址
          - name: KAFKA_BOOTSTRAP_SERVERS
            value: "192.168.89.192:9092"

---
apiVersion: extensions/v1beta1
kind: Deployment
metadata:
  name: kafka-consumer-v1
  ......
    spec:
      containers:
      - name: kafka-consumer
        image: zhaohuabing/istio-opentracing-demo-kafka-consumer:kafka-opentracing
        env:
          ....
          //在这里加入Kafka server地址
          - name: KAFKA_BOOTSTRAP_SERVERS
            value: "192.168.89.192:9092"
Then deploy the application in Kubernetes. The docker images are available in docker hub, you could also build the images yourself from source codes.
kubectl apply -f k8s/eshop.yaml
Input this URL “http://${NODE_IP}:31380/checkout” in your browser to trigger the Restful API of the application, then you should see the generated trace on the Jaeger UI “http://${NODE_IP}:30088”.
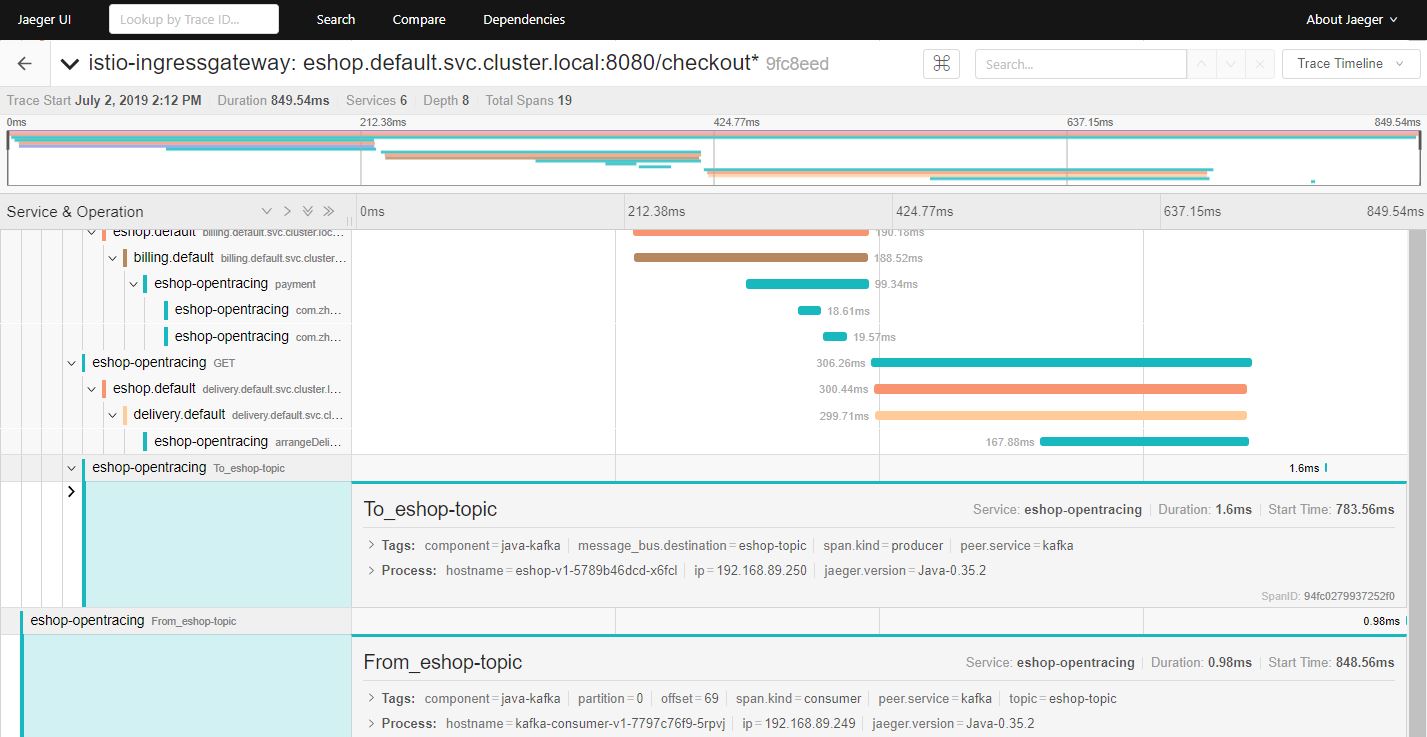
As the above picture shows, two additional spans have been added to the trace, which represents the message handling at Kafka producer and consumer side respectively. We can see that the reference type between From_eshop_topic Span and To_eshop_topic Span is FOLLOWS_FROM instead of CHILD_OF. That’s because it’s an asynchronous message, so Opentracing uses a FOLLOWS_FROM reference type to indicate there’s no direct dependency between these two Spans.
Propagate Tracing Context from Kafka to REST
For now, tracing context has been propagated from REST calls to Kafka messages, but what if we call a REST API of another service in the message consumer? It would be quite helpful if we could also pass the tracing context from Kafka to the called service, unfortunately, Opentracing instrumentation doesn’t behave as we expected.
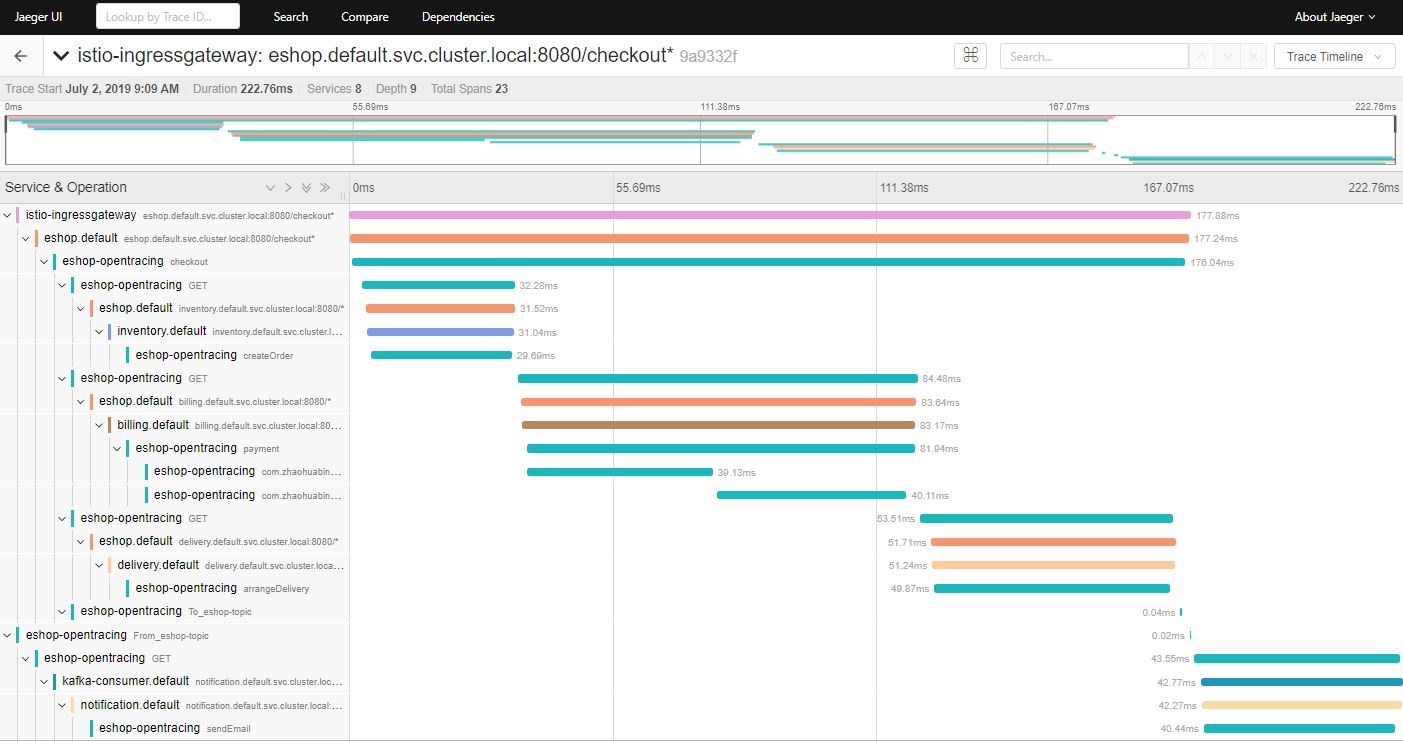
As it shows in the above picture, we can’t see the notification service in the trace of the client request. However, it makes more sense to correlate the REST call to the notification service with the Kafka consumer Span in a single trace because that’s how the client request goes through the system.
We need to know the concept of “Active Span” first to understand what happened. In the context of Opentracing, “Active Span” represents the current work of a running thread. The “Active Span” of a thread will be implicitly set as the parent span of the newly created span if it’s there, as the below Opentracing source code shows:
Tracer.SpanBuilder buildSpan(String operationName)
Return a new SpanBuilder for a Span with the given `operationName`.
You can override the operationName later via BaseSpan.setOperationName(String).

A contrived example:


   Tracer tracer = ...

   // Note: if there is a `tracer.activeSpan()`, it will be used as the target of an implicit CHILD_OF
   // Reference for "workSpan" when `startActive()` is invoked.
   try (ActiveSpan workSpan = tracer.buildSpan("DoWork").startActive()) {
       workSpan.setTag("...", "...");
       // etc, etc
   }

    // It's also possible to create Spans manually, bypassing the ActiveSpanSource activation.
   Span http = tracer.buildSpan("HandleHTTPRequest")
                     .asChildOf(rpcSpanContext)  // an explicit parent
                     .withTag("user_agent", req.UserAgent)
                     .withTag("lucky_number", 42)
                     .startManual();
However, TracingConsumerInterceptor finishes the Span before it hands over the task to Kafka consumer, so no active span in the current thread when the consumer code invokes the REST API of the notification service. That’s exactly the reason why these two spans are not correlated in a single trace.
public static <K, V> void buildAndFinishChildSpan(ConsumerRecord<K, V> record, Tracer tracer,
      BiFunction<String, ConsumerRecord, String> consumerSpanNameProvider) {
    SpanContext parentContext = TracingKafkaUtils.extractSpanContext(record.headers(), tracer);

    String consumerOper =
        FROM_PREFIX + record.topic(); // <====== It provides better readability in the UI
    Tracer.SpanBuilder spanBuilder = tracer
        .buildSpan(consumerSpanNameProvider.apply(consumerOper, record))
        .withTag(Tags.SPAN_KIND.getKey(), Tags.SPAN_KIND_CONSUMER);

    if (parentContext != null) {
      spanBuilder.addReference(References.FOLLOWS_FROM, parentContext);
    }

    Span span = spanBuilder.start();
    SpanDecorator.onResponse(record, span);

    //Span is finished before the consumer logic
    span.finish();

    TracingKafkaUtils.inject(span.context(), record.headers(), tracer);
  }
This issue can be easily fixed after we figure out the root cause. Given that TracingConsumerInterceptor already put the Kafka Span in the message header, we just need to retrieve that Span from the header, and explicitly set it as the parent Span of the REST call.
Here is the code snippet to fix it:
We use a TracingKafka2RestTemplateInterceptor to extract Kafka consumer Span from the message header and set it as the parent Span for the outgoing REST call.
@Override
public ClientHttpResponse intercept(HttpRequest httpRequest, byte[] body, ClientHttpRequestExecution xecution)
        throws IOException {
    ClientHttpResponse httpResponse;
    SpanContext parentSpanContext = TracingKafkaUtils.extractSpanContext(headers, tracer);
    Span span = tracer.buildSpan(httpRequest.getMethod().toString()).asChildOf(parentSpanContext)
            .withTag(Tags.SPAN_KIND.getKey(), Tags.SPAN_KIND_CLIENT).start();
    ......
}
Configure RestTemplate with the TracingKafka2RestTemplateInterceptor.
@KafkaListener(topics = "eshop-topic")
public void receiveMessage(ConsumerRecord<String, String> record) {
    restTemplate
            .setInterceptors(Collections.singletonList(new TracingKafka2RestTemplateInterceptor(record.headers())));
    restTemplate.getForEntity("http://notification:8080/sendEmail", String.class);
}
That’s all! Now open this URL “http://${NODE_IP}:31380/checkout ” in your browser to invoke the eshop service, then you’ll able to see the whole trace in the Jaeger UI “ http://${NODE_IP}:30088”.
From the below diagram, you can see how the client request goes through all the services, no matter it’s a REST call or a Kafka message. With this very nice global view, it would be easy to figure out what’s the bottleneck if there is an abnormal latency, or which service has a problem if the client gets an error response.
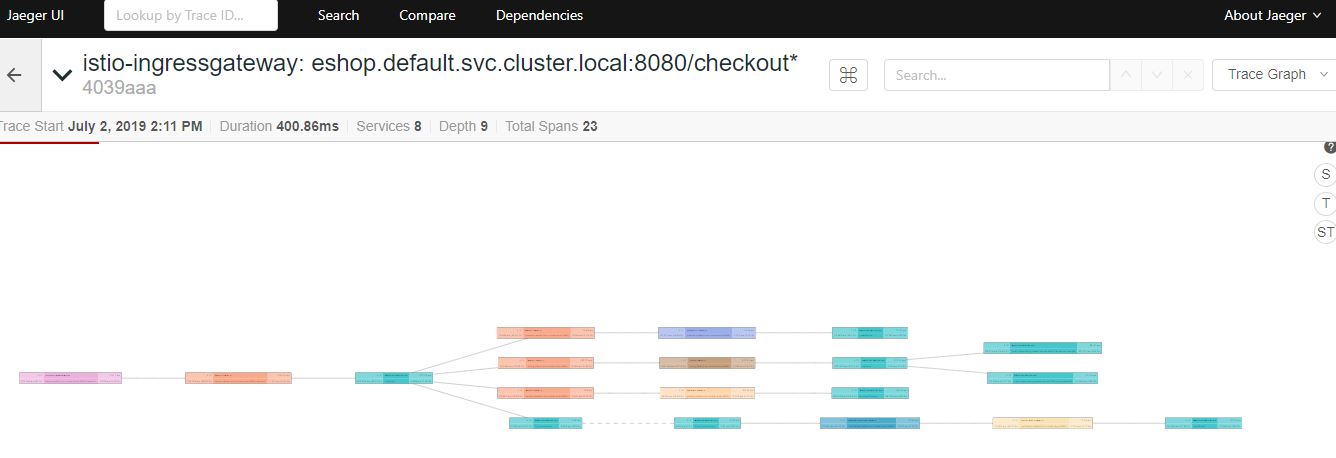
You can also switch between the trace timeline and the trace graph in the Jaeger UI.
Wrap Up
Istio gives you insights into your service mesh by its build-in distributed tracing capability, however, it might not be enough for troubleshooting just by tracing REST calls across process boundaries.
By leveraging Opentracing instrumentation, we could avoid the trivial code for passing HTTP trace header, and include method-level and Kafka message tracing to the Istio generated trace to provide fine-grained tracing information.
An ideal solution should be achieving all these goals at the proxy side rather than instrumenting the application. That’s the purpose the service mesh is created for: to offload all the service communication and governance functionalities such as service interconnections, telemetry, security, etc. to the infrastructure layer and let the application only focus on its business logic.
We’re on the way now, hopefully, we could achieve that ultimate goal soon.
References
- Eshop demo code on Github
- Distributed Tracing with Apache Kafka and Jaeger
- [OpenTracing Apache Kafka Client Instrumentation](https://github.com/opentracing-contrib/java-kafka-client TracingRestTemplateInterceptor.java)
- Kafka quick start